Simplify Dashboard
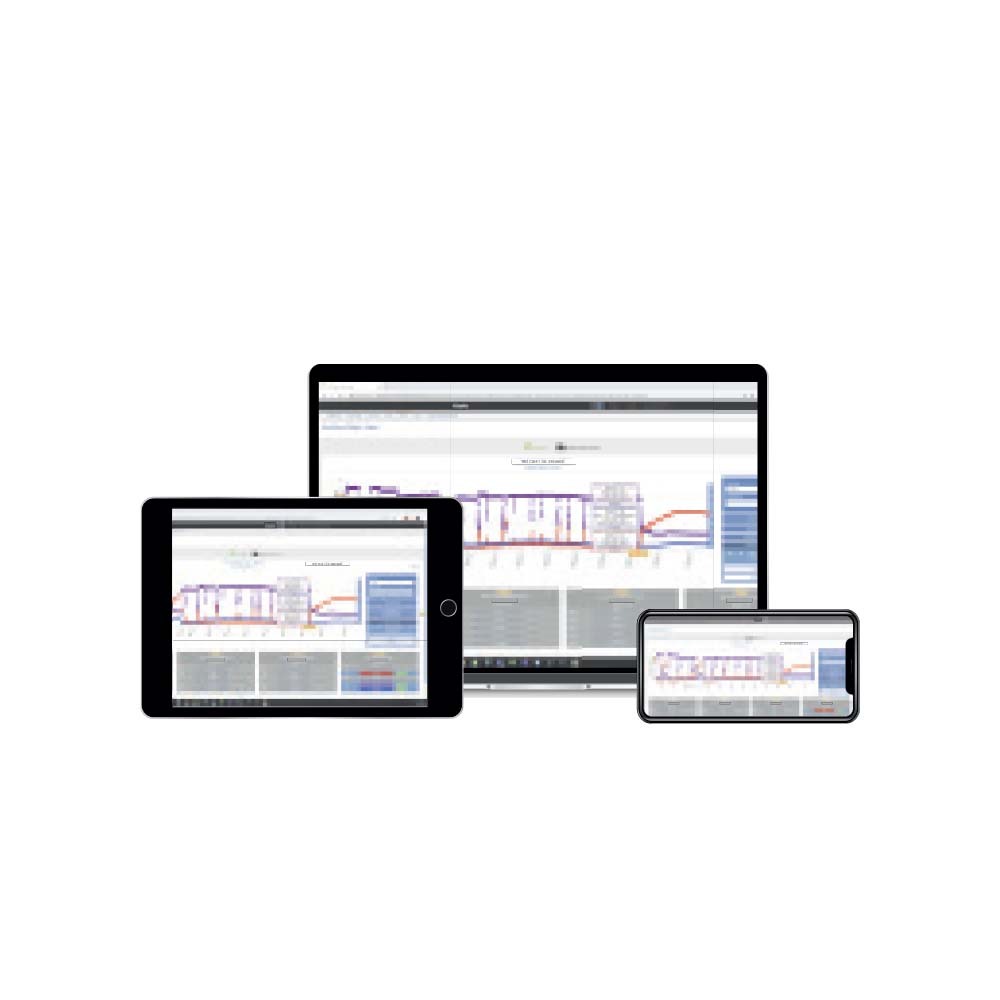
The dashboard presents all of the Simplify data collected from the job site to the user. Each user of the system has their own unique login and visibility of all systems assigned to them, including access to archived information for each system. Hierarchical structures can be created to simulate different authority levels in the business.
Data is presented in both a chart and tabular format showing temperature, relative humidity, vapor pressure, dewpoint and water content from the Simplify Sensor Probes. From the Simplify Relay Box the dashboard shows kW and kWh from connected equipment and from Simplify Integration Sensor the dashboard shows the data from the CDT dehumidifiers such as temperature, relative humidity, kW, kWh, water bucket full and technical faults. Additionally, it shows the remaining power of the Simplify Sensor Box.
The dashboard also enables on/off of the equipment connected to Simplify Relay Boxes and of the CDT.
The user can get alarms sent to programmed email addresses, if equipment becomes passive or exceeds programmed thresholds.
All data can be extracted in Excel-format and an editable Word-file using the Report Generator.
Simplify Dashboard
|
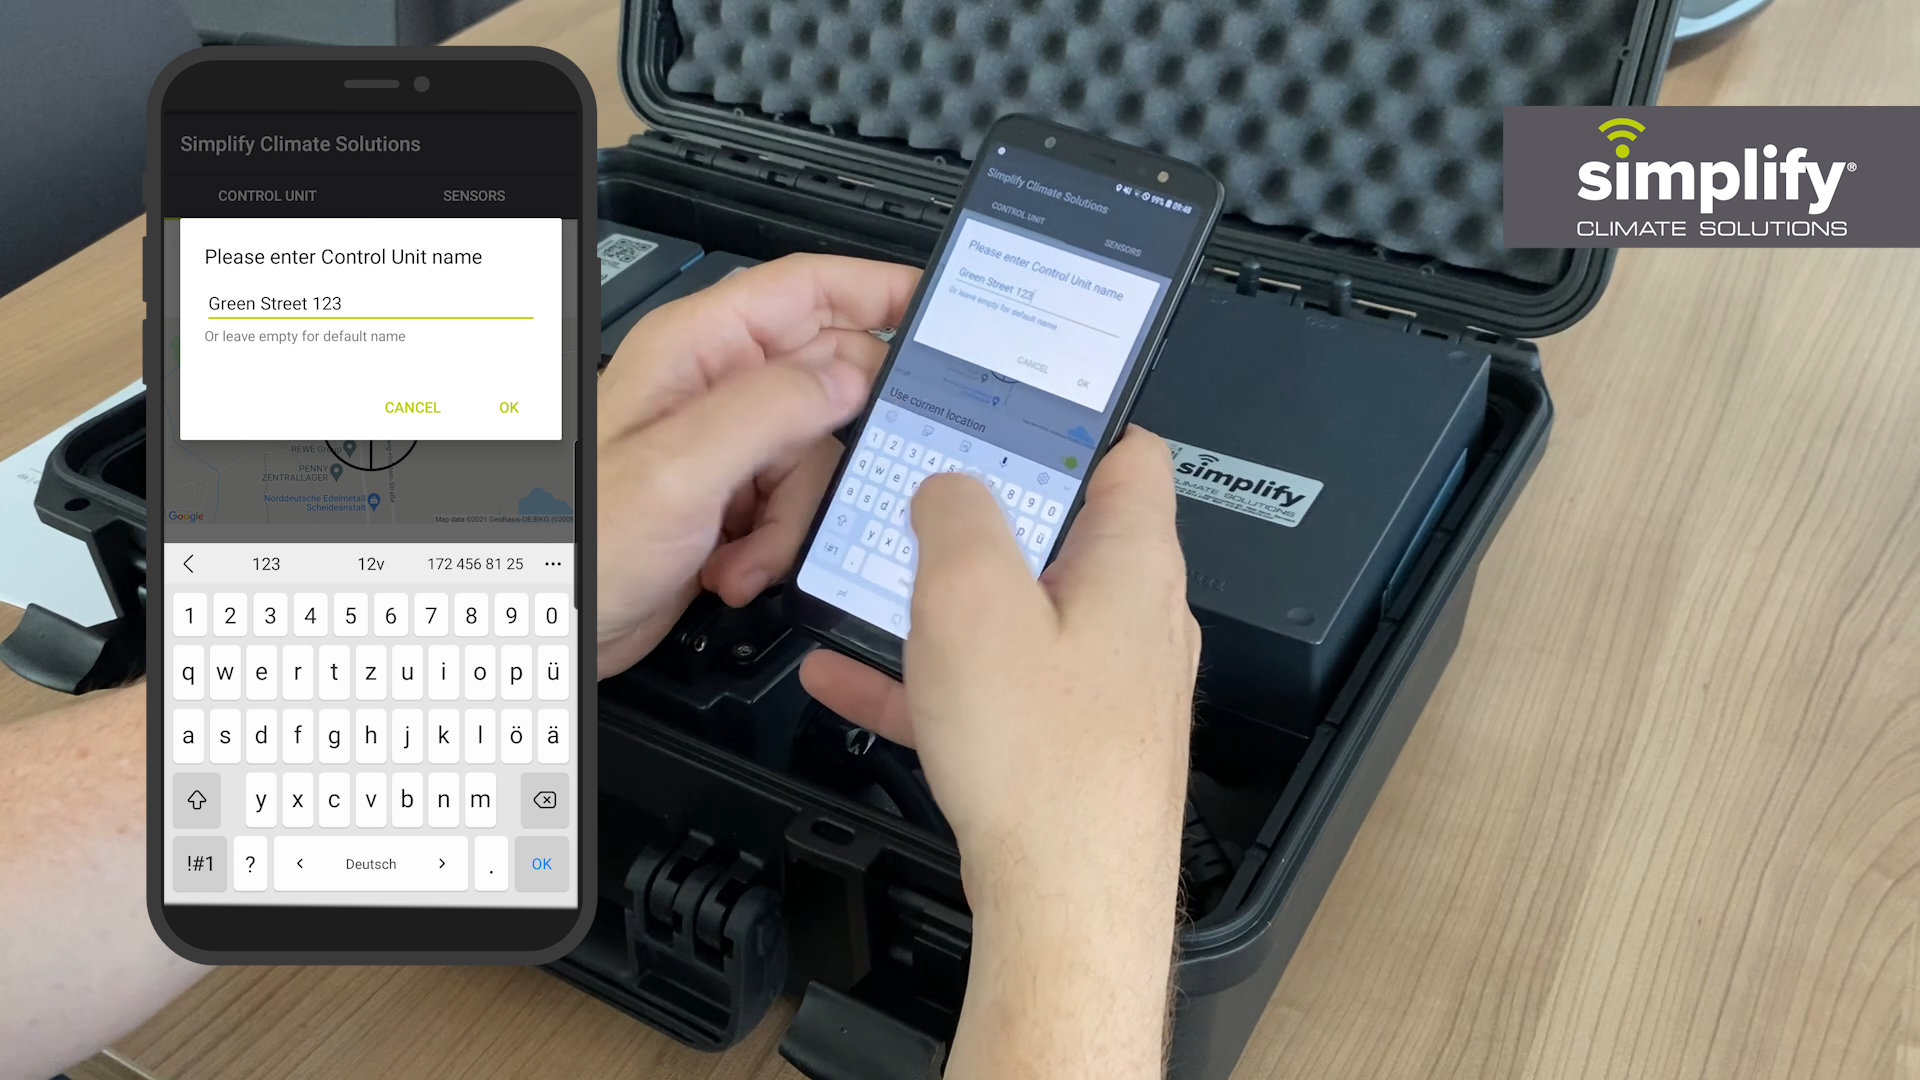
How to program Simplify Climate Solutions
|
Data is presented in both a chart and tabular format showing temperature, relative humidity, vapor pressure, dewpoint and water content from the Simplify Sensor Probes. From the Simplify Relay Box the dashboard shows kW and kWh from connected equipment and from Simplify Integration Sensor the dashboard shows the data from the CDT dehumidifiers such as temperature, relative humidity, kW, kWh, water bucket full and technical faults. Additionally, it shows the remaining power of the Simplify Sensor Box.
The dashboard also enables on/off of the equipment connected to Simplify Relay Boxes and of the CDT.
The user can get alarms sent to programmed email addresses, if equipment becomes passive or exceeds programmed thresholds.
All data can be extracted in Excel-format and an editable Word-file using the Report Generator.
Applications
-
Restoration processes after water damages
-
Environmental analysis of indoor climate
-
The Simplify Dashboard is used to access the data from the Simplify solutions
-
Permanent monitoring of building structures
Características principales
-
The dashboard can be accessed using almost all modern browsers such as Chrome, Internet Explorer, Edge, Firefox, Safari (MAC)
Installation
-
The dashboard is reached at the link: https://simplifyclimatesolutions.com
-
Access to the dashboard is opened after receiving a user and password